Best Forex Indicators for Trend Following
Best forex indicators for trend following: how moving averages, MACD, ADX, and Ichimoku help you ride trends and skip false signals.
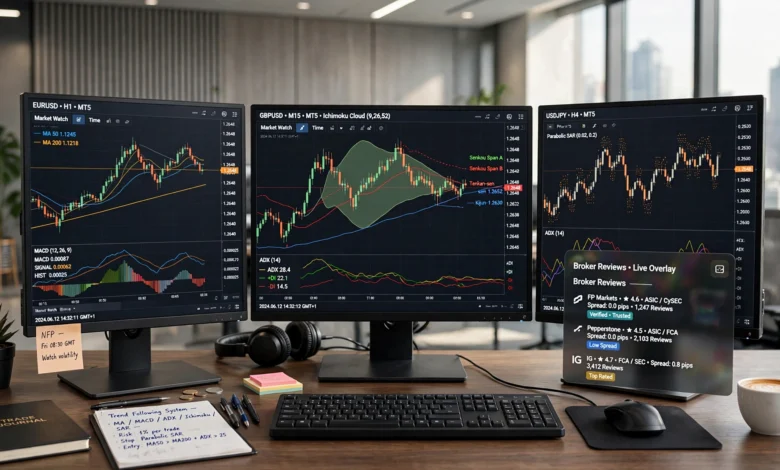
Best forex indicators for trend following are the tools that separate traders who ride a move for two hundred pips from those who get shaken out after twenty. If you’ve ever entered a trade right before the market reversed, or exited a winning position way too early because you got nervous, the problem usually isn’t your instincts. It’s that you’re not reading trend strength and direction with the right tools.
Trend following is one of the oldest approaches in forex trading, and for good reason: currency pairs can trend for weeks or even months once they get going, especially on higher timeframes. But spotting a real trend versus a temporary spike is harder than it sounds. Price doesn’t move in a straight line, and noise can easily be mistaken for momentum.
This is where a good set of trend-following indicators earns its keep. Moving averages, MACD, ADX, Ichimoku Cloud, Parabolic SAR, and a few others each measure a different piece of the puzzle: direction, strength, momentum, or timing. Used well, together they give you a much clearer picture than any single line on a chart ever could.
In this guide, we’ll walk through the best forex indicators for trend following, explain how each one actually works, cover the settings traders rely on, and show you how to combine them without overloading your charts. By the end, you’ll have a practical framework for identifying trends early and staying in them longer.
What Makes an Indicator Good for Trend Following?
Not every indicator is built for trend following, and that’s an important distinction. Some tools, like the RSI or Stochastic, are designed for ranging markets where price bounces between support and resistance. Others, like moving averages and ADX, are built specifically to track direction and strength over time.
A solid trend-following indicator generally does one or more of these things:
- Smooths out short-term noise so you can see the underlying direction
- Confirms trend strength, so you’re not trading a fake breakout
- Signals early entries without lagging so far behind that you miss most of the move
- Helps you stay in a position by showing when momentum is fading, not just when it starts
Keep this checklist in mind as we go through each indicator, because it explains why traders pair certain tools together rather than relying on just one.
1. Moving Averages (SMA and EMA)
Moving averages are the foundation of trend trading, and probably the first indicator most traders ever learn. A moving average smooths price data over a set period so you can see the general direction without getting distracted by every small candle.
There are two versions worth knowing:

- Simple Moving Average (SMA): Averages closing prices equally over a chosen period. It’s smoother and more reliable for identifying the broader trend, but it reacts slowly to sudden price changes.
- Exponential Moving Average (EMA): Weights recent prices more heavily, which makes it more responsive. This is usually the preferred choice for trend followers who want earlier signals.
How traders use moving averages for trend following:
- Price position: When price trades above the moving average, the trend is considered bullish. Below it, bearish.
- Crossovers: A common signal is when a faster EMA (like the 20-period) crosses above a slower one (like the 50-period), suggesting a shift toward an uptrend. The reverse suggests a downtrend.
- Multiple timeframe alignment: Many traders stack a 20, 50, and 200-period moving average on the same chart. When all three line up in the same direction, it’s a strong sign the trend has real conviction.
The tradeoff with moving averages is lag. Because they’re based on past prices, they confirm a trend after it has already started, not before. That’s fine for trend following, since the goal is to ride an established move rather than predict the exact turning point.
2. MACD (Moving Average Convergence Divergence)
The MACD blends trend-following and momentum in a single tool, which is why it shows up on almost every list of essential indicators. It’s built from two EMAs (typically 12 and 26-period) and a signal line (usually a 9-period EMA of the MACD line itself).
What to watch for:
- MACD line crossing above the signal line: Often read as a bullish signal, suggesting upward momentum is building.
- MACD line crossing below the signal line: Suggests downward momentum.
- Histogram size: The bars between the MACD line and signal line show how strong the momentum is. Growing bars mean the trend is accelerating; shrinking bars often warn that momentum is fading before a reversal.
- Zero-line crosses: When the MACD line crosses above zero, it can confirm a shift from a downtrend to an uptrend, and vice versa below zero.
One thing worth noting: the MACD works best in genuinely trending markets. In choppy, sideways conditions, it tends to whipsaw and generate false signals, so it’s smart to pair it with a strength filter like ADX before acting on a crossover.
3. Average Directional Index (ADX)
The ADX is a little different from most trend indicators because it doesn’t tell you direction at all. It only measures strength. That makes it one of the most useful trend-following indicators for filtering out weak, sideways markets where other signals tend to fail.
Reading the ADX:
- Below 20: Weak or non-existent trend. Trend-following strategies tend to underperform here.
- 20–25: A trend may be forming, but it’s not confirmed yet.
- Above 25: A trend is considered strong enough to trade with confidence.
- Above 40–50: A very strong, possibly extended trend.
The ADX is usually plotted alongside two supporting lines, +DI and −DI, which show direction. When +DI sits above −DI, buyers are in control. When −DI is above +DI, sellers are.
A practical way to use ADX is as a gatekeeper. Before acting on a moving average crossover or MACD signal, check the ADX. If it’s below 20, you might sit out or switch to a range-trading approach instead. If it’s climbing above 25, that’s your cue that a trend-following entry has a better chance of working.
4. Ichimoku Cloud
The Ichimoku Cloud looks intimidating at first glance because it packs several data points into one chart, but it’s genuinely one of the more complete trend-following systems available. Developed in Japan, it shows trend direction, momentum, and support and resistance all at once.
The main components are:
- Tenkan-sen (Conversion Line): A short-term average, similar to a fast moving average.
- Kijun-sen (Base Line): A medium-term average that acts like a slower moving average.
- Senkou Span A and B: These two lines form the “cloud” (Kumo), which represents a dynamic support and resistance zone.
- Chikou Span: The lagging line, plotted behind current price, used to confirm momentum.
How to read it for trend following:
- Price trading above the cloud signals an uptrend; below it signals a downtrend.
- A thick cloud suggests strong support or resistance, while a thin cloud suggests the level could break easily.
- When the Tenkan-sen crosses above the Kijun-sen while price is above the cloud, it’s often treated as a strong bullish signal.
Because it combines so many elements, the Ichimoku Cloud can replace two or three separate indicators on your chart. The tradeoff is a slightly steeper learning curve for new traders.
5. Parabolic SAR
The Parabolic SAR (Stop and Reverse) plots a series of dots above or below price, and it’s built specifically for trend-following exits as much as entries. When the dots sit below the candles, the trend is bullish. When they flip above the candles, the trend has turned bearish.
Why traders like it:
- It gives clear, visual entry and exit points without much interpretation needed.
- It works well as a trailing stop mechanism, adjusting as the trend develops.
- It’s easy to combine with other trend indicators as a confirmation tool.
The main drawback is that Parabolic SAR performs poorly in ranging markets, flipping back and forth and generating a lot of false signals. It’s best used only once a trend has already been confirmed by something like ADX or a moving average setup.
6. Bollinger Bands (for Trend Context)
Bollinger Bands are usually associated with volatility and mean reversion, but they’re also useful for confirming trend strength, which is why serious trend followers keep them on their charts.
Key signals for trend traders:
- Band walking: When price consistently hugs the upper band during an uptrend (or the lower band during a downtrend), it’s a sign of strong, sustained momentum rather than an imminent reversal.
- Band squeeze: When the bands narrow significantly, it often precedes a strong breakout, which can be the start of a new trend.
- Band expansion: Widening bands during a trend confirm that volatility and momentum are increasing together, supporting the move.
Bollinger Bands work particularly well alongside the MACD or ADX, since the bands show volatility context while the other tools confirm direction and strength.
7. Supertrend Indicator
The Supertrend indicator has become increasingly popular, especially among traders who want a clean, visual way to follow a trend without overanalyzing multiple lines. It’s calculated using price volatility (through the Average True Range) and plots a single line above or below price.
How it works:
- When price is above the Supertrend line, it signals an uptrend, and the line typically turns green.
- When price drops below the line, it flips to signal a downtrend, usually turning red.
- The flip points double as both entry signals and trailing stop levels.
Its simplicity is the appeal: one line, one color change, one decision. It performs best on trending instruments and higher timeframes, and like Parabolic SAR, it can whipsaw in a sideways market.
How to Combine Trend-Following Indicators Without Overloading Your Chart
A common mistake among newer traders is stacking five or six indicators that all measure the same thing in slightly different ways. Two moving averages, an EMA-based MACD, and a moving-average crossover strategy are really just variations of one signal. That kind of overlap creates a false sense of confirmation rather than genuine confidence.
A better approach is to pick indicators from different categories:
- One directional tool: Moving averages or Ichimoku Cloud to establish the overall trend.
- One strength filter: ADX to confirm the trend is strong enough to trade.
- One momentum or timing tool: MACD or Parabolic SAR to fine-tune entries and exits.
For example, a straightforward trend-following setup might use a 50 and 200-period EMA to define the trend, ADX above 25 to confirm strength, and MACD crossovers to time entries. This combination covers direction, strength, and timing without duplicating information.
Common Mistakes Traders Make With Trend Indicators
Even with the right tools, execution is where most trend-following strategies fall apart. A few patterns show up again and again:
- Trading every crossover signal, even in choppy markets where ADX clearly shows a weak trend
- Ignoring higher timeframes, which often reveals that a “trend” on the 5-minute chart is just noise inside a much larger range
- Exiting too early out of fear, rather than trusting a trailing stop like Parabolic SAR or Supertrend
- Adding too many indicators, which leads to conflicting signals and hesitation at the exact moment a decision needs to be made
- Forgetting risk management, since no indicator, however reliable, replaces a stop-loss and proper position sizing
Trend-following indicators can meaningfully improve your read on the market, but they work best as decision-support tools within a broader trading plan, not as a substitute for one.
Choosing the Right Indicators for Your Trading Style
The right combination really depends on how you trade. Scalpers and day traders often lean on faster EMAs and MACD for quick signals, since they need responsiveness more than smoothness. Swing traders tend to favor the Ichimoku Cloud or a 50/200 EMA setup combined with ADX, since these hold up better over multi-day moves. Position traders, who might hold trades for weeks, often rely on longer-period moving averages and Supertrend on daily or weekly charts to avoid getting shaken out by short-term pullbacks.
It’s also worth testing your chosen indicators on a demo account or with historical data before committing real capital. Markets and currency pairs behave differently: what works well on EUR/USD during a strong trending period might perform poorly on a range-bound pair like EUR/CHF. For traders wanting a deeper technical foundation, resources like Investopedia’s guide to technical indicators and the CME Group’s educational materials on trend analysis are solid starting points for building out your knowledge beyond this article.
Conclusion
Trend following remains one of the most consistent ways to trade forex, but only when it’s built on tools that actually measure trend direction, strength, and momentum rather than noise. Moving averages give you the baseline direction, MACD adds momentum context, ADX filters out weak markets before you waste a trade on them, and tools like Ichimoku Cloud, Parabolic SAR, and Supertrend round out entries, exits, and broader market structure.
The goal isn’t to load your chart with every indicator available. It’s to choose two or three that cover different angles of the market, apply them consistently, and pair them with sound risk management. Do that, and you’ll spend a lot less time guessing whether a move is real, and a lot more time actually riding it.